Dashboards in Sparkflows
- Sparkflows
- Mar 10, 2017
- 1 min read

Sparkflows allows you to build rich Dashboards in minutes.
In Sparkflows, processing is defined with workflows. Various nodes are connected in a workflow to build the processing pipeline. Sparkflows also provides visualization nodes like charts, forests and tables to be included in the workflow. This way, when the workflow executes, they are able to produce rich visualizations.
The Dashboards functionality in Sparkflows allows you to bring together the output of nodes of various workflows together for viewing in one place. When the dashboard is viewed, the various charts, forests and tables get displayed.
This way, you can seamlessly go from defining workflows, executing them, and having the results displayed in a Dashboard.
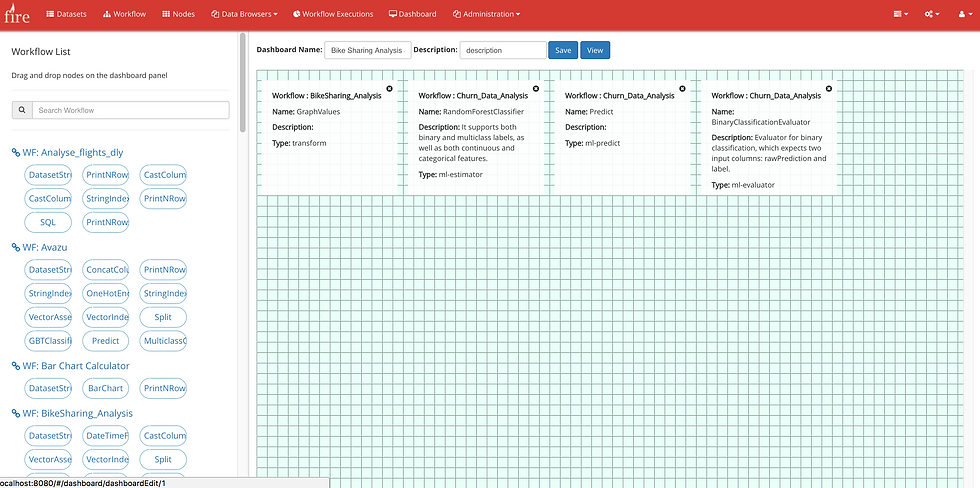
Creating a New Dashboard
Below we see a dashboard in edit mode. The various workflows and their nodes are available in the left panel.
The nodes of the various workflows are dragged and dropped into the editor panel.
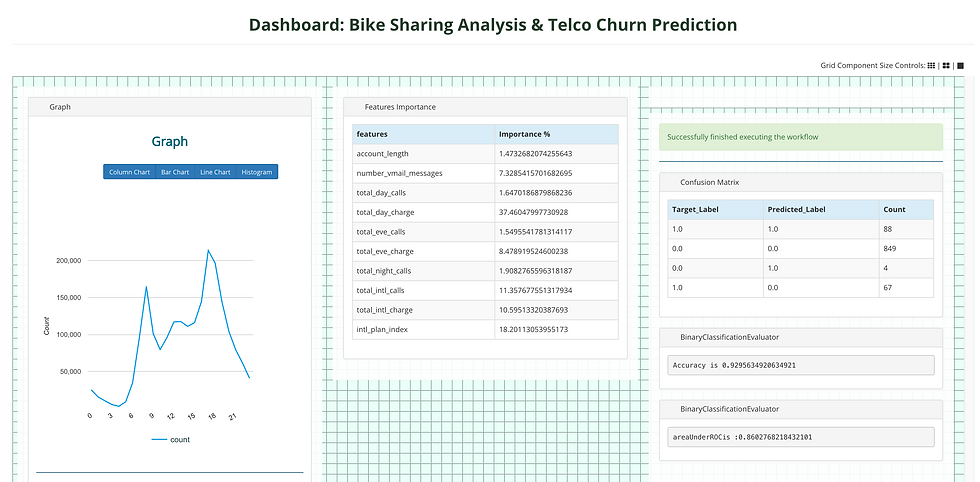
Viewing the Dashboard
Below we see the Dashboard in action displaying the results of workflow executions.


Thanks for taking the time to share this